AMS Industrial Dashboard
This document outlines the UX concept validation for an application designed to monitor theperformance of various industrial products, focusing on key metrics such as memory usage, systemefficiency, and overall product performance. The application aims to provide actionable insights andrecommendations to enhance software usage and propose value-driven product updates tailored touser needs.
Problem Statement
Customers often struggle to maximize the value of their software due to limited usage, unclear upgrade paths, and inflexible contract options. Traditional licensing models and infrequent product updates can hinder long-term commitment and seamless adoption. Moreover, the absence of a structured migration and upgrade schedule can lead to inefficient planning and unexpected downtimes. To tackle these challenges, a subscription-based model with value-driven updates, tailored service offerings, and a clear upgrade roadmap is essential, along insights focused on after-market service (AMS) to improve post-purchase engagement and customer satisfaction.

Professional
Goals
-
Increase usage of software by customer
-
Increase HCI delivering value as well as sustaining value
-
Customer should opt for a 5-year contract instead of a regular 1- or 3-year contract
-
Proposing product updates on a value-based priority
-
Targeting customer "operational excellence program (digitization drive)" to renew BGP and service offering
-
Change from BGP to subscription offerings to better
-
A scheduled upgrade and migration calendar helped the customer to plan downtimes better
-
Proposing product updates on value-based priority timelines
-
Service offerings as features meet customer requirements
-
Packaged as part of a subscription model with better value and continued evolution or offerings
Hypotheses
In focusing on the customer experience and support, we’ve created hypothetical personas to aid us in better interacting with our audience. As of now, we are working towards an understanding of the After Market Service (AMS) Manager persona. This persona is meant to help us engage clients after they make a purchase and are looking for ways to keep them satisfied. We will enable AMS practitioners to give exemplary service and support by understanding their specific needs and challenges.
01
Define the Project Scope
Objectives:Clearly define what you want to achieve with the dashboard (e.g., data visualization, reporting, monitoring KPIs).
Target Audience: Identify who will be using the dashboard (e.g., executives, analysts, end-users) and understand their needs and pain points.
Key Features:List essential features based on user needs, such as customizations, filters, and data sources.
02
Conduct Research and Gather Requirements
User Interviews: Conduct interviews with potential users to gather insights about their workflows and what they expect from the dashboard.
Competitive Analysis: Study existing dashboard solutions to identify best practices and areas of opportunity.
03
Create User Personas and User Stories
User Personas: Develop personas based on research to represent different user types and their goals.
Experience Outcomes (XO): Write user stories that outline the desired features and functionalities from the perspective of users (e.g., "As a user, I want to filter data by date range so that I can analyze trends over time").

Methodology
User Story 01
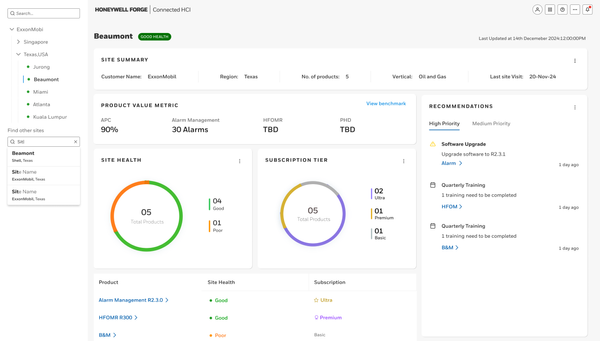
Site Summary Display for Customer Details
As a user, I want to view a summary of key site details for each customer, including essential data, so that I can quickly assess their overall status and make informed decisions.
Acceptance Criteria:
-
Display the following customer details:
-
Customer Name
-
Region
-
Number of Products
-
Industry Vertical
-
Date of Last Site Visit
-
Last Updated Timestamp
-
-
Include sections for:
-
Product Value Metrics (APC percentage, alarm counts, HFORM/PhD values)
-
Site Health (total number of products, number in 'Good' and 'Poor' status)
-
Subscription Tier (details of Ultra, Premium, and Basic subscriptions)
-
Recommendations (high/medium-priority tasks like software upgrades and scheduling)
-
-
Ensure dynamic updates based on the latest available information.
-
Users must be able to click "View Benchmark" for additional insights.
-
Implement search functionality for quick access to customer sites.
-
Provide a recent visits history list for easy reference.
-
Ensure consistency with the existing app layout and UX standards.
-
Make the feature accessible from the main dashboard of the Connected HCI app.
User Story 02
Product Details Summary on Dashboard
As a user, I want to view a summary of product details for each customer, including essential data, so that I can quickly assess system health and make informed decisions.
Acceptance Criteria:
-
Display overall system health status (e.g., “GOOD HEALTH”) with the last update timestamp.
-
Show hardware health as a percentage with a status indicator (e.g., GOOD, POOR).
-
Display software health in a similar format, highlighting current status.
-
Show compatibility percentage and status indicators for insight into system compatibility.
-
Include a “RECOMMENDATIONS” section with high and medium-priority suggestions.
-
Software upgrade recommendations must include current and recommended versions with a clickable link.
-
Display key metrics under “SOFTWARE USAGE” (e.g., total assets in DB, operator positions).
-
Include feature usage data (total active alarms, scheduled reports, event metrics).
-
Show the total number of tags used against the allowed limit.
-
Display location-based data supporting multiple sites.
-
Provide a link/button labeled “Show Health Summary” for a detailed view.
-
Ensure premium status and subscription information is visible.
-
Make the dashboard responsive across devices and screen sizes.

Persona Identification


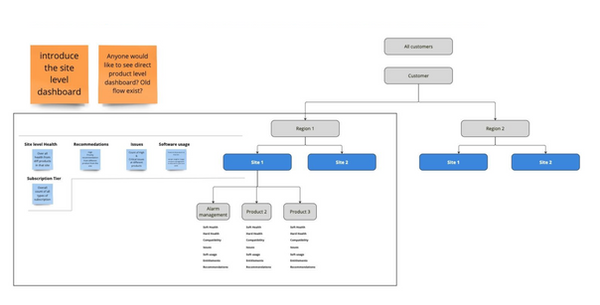
Information Architecture


Concepts

Wireframes

Interaction Design


